Analyzing Website Performance Using Google Analytics
Used Google Analytics to extract user acquisition, engagement, and monetization data for the Google Merchandise Store. Identified trends in traffic sources, cart abandonment, and best-selling products to generate actionable business insights.
Project Type
Marketing Analytics | Web Analytics | E-Commerce Insights
Date
July 2025

Project Overview
To develop fluency with Google Analytics (GA4) and apply data to real-world scenarios, I analyzed traffic and user behavior for the Google Merchandise Store. I reviewed metrics from the Life Cycle section, including User Acquisition, Engagement, and Monetization, or the month of January 2024, focusing on first-time users, event-level behavior, and product performance.
This project equipped me to translate analytical insights into strategic recommendations for improving conversions and optimizing marketing efforts.
Step 1: Accessing the Template and Demo Account
To start, I accessed a template specifically created for this training assignment. This template allowed me to track and organize the metrics I gathered from Google Analytics. I then accessed the Google Analytics demo account for the Google Merchandise Store, ensuring I was signed into my Google account and, if necessary, using Incognito mode for access.
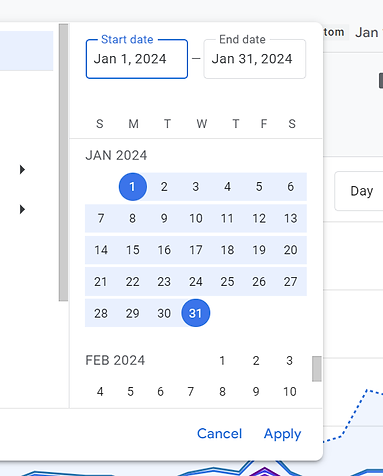
Step 2: Setting the Time Frame
I set the date range for the analysis to the month of January 2024 (January 1–31). This was important to ensure that all data points corresponded to the correct time frame, so I could give an accurate representation of user behavior during that month.
Step 3: User Acquisition Metrics
I began with acquisition metrics, specifically focusing on the total number of new users and the number of new users arriving via different search engines, including Google, Bing, YouTube, and Baidu.
Using the First user source filter under the User acquisition report, I extracted and recorded the following data:
-
Total new users
-
New users from Google, Bing, YouTube, and Baidu
-
Percentage of new users from each search engine, calculated with the formula
.png)
.png)
Step 4: Engagement Metrics
Next, I focused on engagement metrics, which included key user events such as:
-
session_start
-
begin_checkout
-
remove_from_cart
-
Purchase
.png)
.png)
I accessed the Events section and expanded the view to show 50 rows per page, allowing me to see all event data at once. For each of these events, I recorded the total number of users involved.
Additionally, I calculated:
Cart abandonment rate by subtracting the total users for "purchase" from the total users for "begin_checkout."
Sales conversion rate by using the formula:
\text{Sales conversion rate} = \left( \frac{\text{Total users for purchase}}{\text{Total users for session_start}} \right) \times 100
Step 5: Monetization Metrics
I then gathered monetization data from the Monetization section of the Google Analytics tool. Specifically, I recorded:
-
Total revenue for the month of January
-
Number of first-time buyers
-
Top three best-selling items along with the quantities sold, which were located in the pane labeled "Ecommerce purchases by item name."
.png)
.png)
Insights and Observations
-
Search Engine Performance: The number and percentage of new users varied across search engines. Insights into the performance of platforms like YouTube and Baidu provided valuable information on how users from different sources interacted with the Google Merchandise Store.
-
Cart Abandonment: I calculated the number of users who initiated checkout but did not complete the purchase, providing insight into potential user experience improvements.
-
Sales Conversion Rate: The sales conversion rate gave a measure of how effectively the site turned visitors into buyers.
-
Monetization: Observing the best-selling items and the overall revenue helped identify what products were driving the store's success during January.
Key Takeaways
This project allowed me to familiarize myself with Google Analytics and its application to real-world business needs. By understanding how to navigate acquisition, engagement, and monetization metrics, I gained insights into user behavior and performance optimization strategies for the Google Merchandise Store. These skills are now part of my portfolio and will be useful in future marketing analytics work.